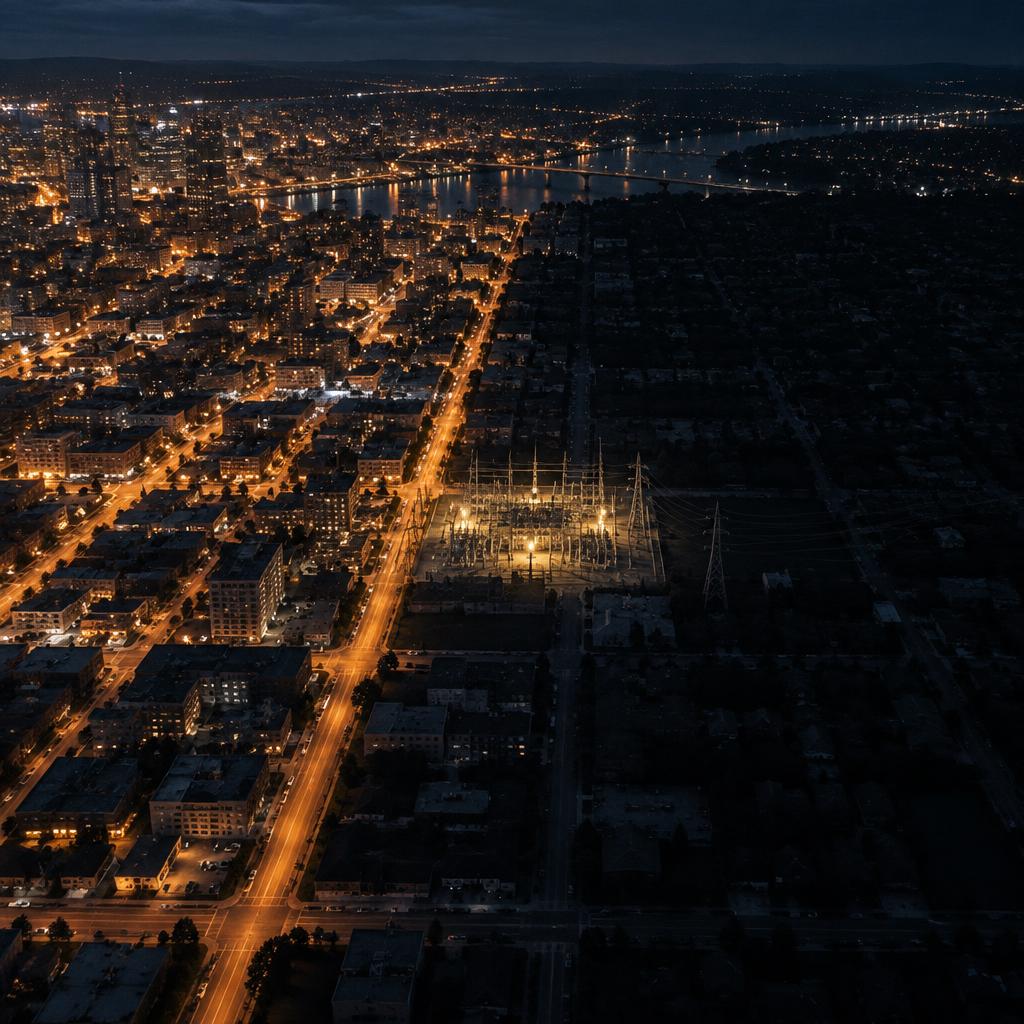
At 4:13 pm on 14 August 2003, more than 50 million people in the north-eastern United States and Ontario lost power. Nine minutes earlier, everything had looked normal. By the next morning the headlines had found their culprit: a tree in Ohio. The real story is more interesting, and a good deal less comfortable, than that.
What actually happened (it was not the tree)
The final report of the U.S.-Canada Power System Outage Task Force, delivered to the US President and the Canadian Prime Minister in April 2004, reconstructs the afternoon to the second. At 1:31 pm, FirstEnergy loses Eastlake unit 5. At 3:05 pm, three of its 345 kV lines fail after contact with trees that had grown up inside the right-of-way. Between 3:39 and 4:06 pm, sixteen 138 kV lines trip. At 4:05:57 pm the Sammis-Star line goes and the cascade begins. By 4:13 pm it is over: 263 power stations and 531 generating units shut down, roughly 61,800 MW of load affected.
The trees were the trigger. They were not the cause. The Task Force lays it out in four layers. FirstEnergy had failed to trim vegetation adequately in its transmission corridors. The alarm system in its control room had silently failed because of a software fault in the energy management system, and nobody noticed: operators kept working for over an hour with a screen that was no longer telling the truth. They had no contingency analysis tool in routine use, so they did not understand that their network was deteriorating. And the regional coordinator, MISO, had a problem of its own: its state estimator had failed on a data error and could not see that FirstEnergy was overloaded.
Put another way, the grid did not fall because of a tree. It fell because several organisations believed they knew the state of their infrastructure, and did not. The cost, according to the estimates compiled by the US Department of Energy, was between 4 and 10 billion dollars in the United States; in Canada, GDP fell 0.7 per cent in August and 18.9 million working hours were lost. The report closed with 46 recommendations, and with a sentence worth re-reading: the causes were "strikingly similar" to those of earlier blackouts.
What changed afterwards: an obligation to look
Until 2003, reliability standards in North America were voluntary. The Energy Policy Act of 2005 gave FERC the power to approve mandatory standards and to certify an electric reliability organisation, NERC. On 16 March 2007, FERC Order 693 approved 83 of the 107 proposed standards. Among them was one born directly of that August afternoon: FAC-003, transmission vegetation management.
FAC-003 requires every line owner to keep a documented vegetation management programme, to schedule right-of-way inspections, to document clearances and, crucially, to calculate them under real conditions: conductor sag at maximum operating temperature and blow-out under wind. It also requires every vegetation-related outage to be reported in one of three categories: trees growing into the line, trees falling from inside the corridor and trees falling from outside it. The current version, FAC-003-5, has been in force since 1 April 2024 and turns on a simple idea: no vegetation may encroach on the minimum vegetation clearance distance (MVCD) of an applicable line.
The standard does not say how to measure. But the industry converged quickly on an answer: airborne LiDAR. A laser scanner on a helicopter captures a point cloud of conductor, vegetation and terrain at around 100 km a day and at densities above 20 points per square metre. The cloud is classified, the catenary is modelled and the sag recomputed at maximum temperature; the software flags every point of vegetation inside the forbidden zone. What used to be a crew walking the corridor with a tape became a complete geometric model of the line.
Two decades on, the enforcement regime is very much alive. According to ReliabilityFirst, one of NERC's regional entities, since 2020 FAC-003 violations have carried the highest average penalty of any non-cyber standard, at more than 200,000 dollars per violation, and 58 per cent of them were classed as serious risk.
Infrastructure data expires, and it does not warn you
The most revealing part of that ReliabilityFirst bulletin is not the size of the fines but the root causes it lists. Too long between inspections. Inspections carried out in the wrong season, when foliage could not be seen. Incorrect sag and sway calculations. And one that should trouble any asset manager: "gaps in asset data integration", such that some lines were never added to the clearing schedule at all. Twenty-two years after the blackout, in other words, the most common failure mode is the one from 2003: the organisation believes it knows its infrastructure, and that knowledge has an expiry date nobody wrote down.
That is the point. A tree grows. A conductor ages and its sag increases. A tower settles. A transformer is replaced and nobody updates the drawing. The measurement we took yesterday describes a reality that no longer exists, and the worst of it is that it does not warn you: the database returns the same number with the same confidence on day one and in year ten. Measuring once is not knowing. Knowing means knowing when it was measured, how, to what accuracy, and when it is time to go back.
This holds for vegetation, and it holds just as well for the physical inventory. How many network operators can say, for every tower, every insulator string, every disconnector in a substation, what is installed, what condition it is in and when it was last checked? The honest answer is usually: for part of the network, yes; for the rest, we have the as-built drawings.
Europe, 28 April 2025: another blackout, the same lesson
There is no need to look to Ohio. At 12:33 CEST on 28 April 2025 the Iberian Peninsula went dark. ENTSO-E, the European association of transmission system operators, set up an expert panel led by an operator unaffected by the event. It published a factual report on 3 October 2025 and its final report on 20 March 2026.
The causes have nothing to do with trees. The panel describes a voltage phenomenon: oscillations, gaps in voltage and reactive power control and differences in voltage regulation practices which, in combination, produced fast voltage rises in Spain, output reductions and cascading generator disconnections. The report makes 23 recommendations, 13 of them tied directly to root causes, and groups them under four headings: stronger operational practices, better monitoring of system behaviour, closer coordination and data exchange between actors, and regulation that keeps pace with a system that has changed.
Notice that two of the four headings are, at bottom, about data: seeing better and sharing better. It is the 2004 conclusion with different technology in the background. In 2003 the problem was an untrimmed corridor and a screen with no alarms; in 2025, a system whose real dynamics did not match the ones its actors believed they were operating. In both cases the infrastructure had changed faster than anyone's knowledge of it.
What we do with this
At Azimutal we have spent three decades measuring territory, and a growing share of that work is precisely this problem: turning a piece of infrastructure into data that can be checked again. We have captured more than 10,000 kilometres of power lines with airborne and mobile LiDAR, using our own sensors and our own point-cloud classification software, which is what lets us separate conductor, tower, vegetation and ground without an operator labelling every span by hand.
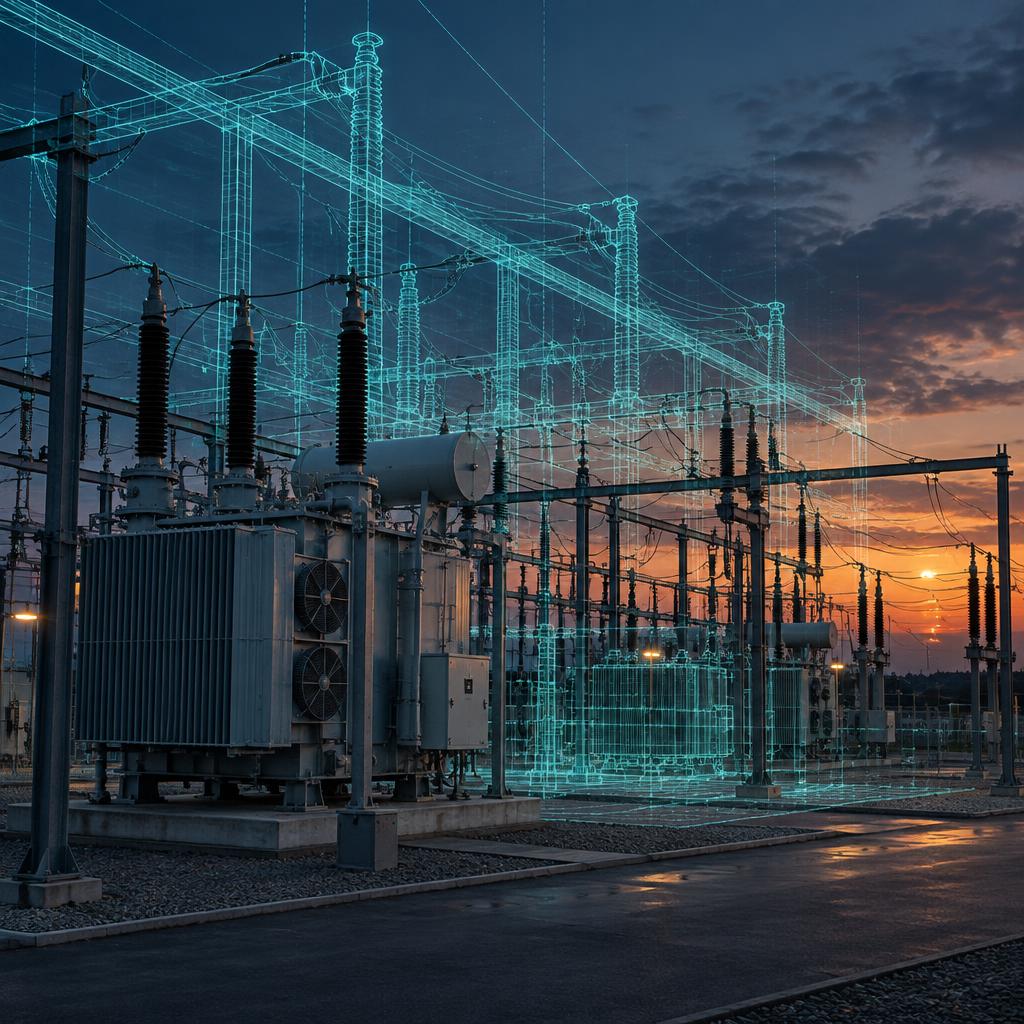
The next question was obvious. If we already have the point cloud of the line and the substation, why does the inventory still live in a spreadsheet? That is where GridScan comes from, our technology for inventorying an electrical network. From multi-sensor capture it automatically generates a digital twin of the network and an inventory of every component: a structured 3D model with free navigation, to which documentation can be attached and sensors integrated. It was developed on real network projects, is in use by clients and is still being developed within our Ring System, in the ring where a technology stops being a prototype and starts being a tool.
The underlying idea is modest and, we think, right: a digital twin is not a pretty model, it is an inventory with a date on it. Every component carries a record of when it was measured and with what; when it is captured again, the two are compared. That is the difference between owning a drawing and owning knowledge. The 2003 blackout was not caused by a tree; it was caused by a network nobody had looked at again. The cheap thing is not measuring once. The cheap thing is knowing when to go back.
Sources
- U.S.-Canada Power System Outage Task Force: Final Report Implementation — U.S. Department of Energy, 2006
- Interim Report: Causes of the August 14th Blackout (presentation) — FERC / U.S.-Canada Power System Outage Task Force, 2003
- Final Report on the August 14, 2003 Blackout in the United States and Canada: Causes and Recommendations — U.S.-Canada Power System Outage Task Force (LBNL record), 2004
- Order No. 693, Mandatory Reliability Standards for the Bulk-Power System — FERC / Federal Register, 2007
- Compliance Through Deployment of LiDAR Technology – NERC FAC-003 — Renewable Energy World, 2011
- Update to FAC-003-5 brings sweeping changes to transmission classifications starting April 1 — TRC Companies, 2024
- Enforcement Explained: Trends in vegetation management — ReliabilityFirst (NERC Regional Entity), 2025
- 28 April 2025 Iberian Blackout: Expert Panel Final Report — ENTSO-E, 2026
- Combination of voltage and oscillation caused Iberian blackout, says ENTSO-E report — PV Tech, 2026
- Investigation into the Iberian blackout of 28 April 2025 — ERSE, 2025